One out of every 10 adults in the U.S. has diabetes and that number may double or triple by 2050, according to the Centers for Disease Control and Prevention.
In a new study, the CDC said that prevalence of the disease is expected to rise over the next 40 years for several reasons:
- An aging population is more likely to develop type 2 diabetes.
- Increases in minority groups that are at high risk for type 2 diabetes.
- People with diabetes are living longer.
"These are alarming numbers that show how critical it is to change the course of type 2 diabetes," said Ann Albright, PhD, RD, director of CDC's Division of Diabetes Translation, in a CDC press release. "Successful programs to improve lifestyle choices on healthy eating and physical activity must be made more widely available, because the stakes are too high and the personal toll too devastating to fail."
Use the interactive chart below to track diabetes prevalence among U.S. adults from 1980 to 2008.

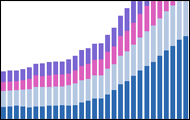
Use the interactive stack graph below to track diabetes prevalence in the U.S. by age group from 1980 to 2008.

About the Data
The data used in the study come from the U.S. Census Bureau and the CDC. The Census data are based on the 2000 Census and include estimates of the 2007 population and estimates of mortality rates, net migration, and births from 2008 through 2050. The CDC data include estimates and standard errors of incidence rates of diagnosed diabetes for the US adult population (aged 18-79 years) from 1980 through 2007, according a provisional version of the report: Projection of the Year 2050 Burden of Diabetes in the U.S. Adult Population Dynamic Modeling of Incidence, Mortality, and Prediabetes Prevalence.
The sources used in the data visualizations also come from the CDC, but cover U.S. adults and all age groups for a slightly longer time period.
- Number (in Millions) of Civilian, Non-Institutionalized Adults with Diagnosed Diabetes, United States, 1980-2008
- Number (in Thousands) of Civilian, Noninstitutionalized Persons with Diagnosed Diabetes, by Age, United States, 1980-2008
What Do You Think?
Share your thoughts in the comments section below or weigh in on Facebook or Twitter.
Data visualization by Anthony Calabrese, a State of the USA Web producer.