New data show a widening income gap between the richest and poorest Americans -- the largest on record, according to the latest Census release.
Working with household income data, disparities are generally shown by looking at income by percentiles. The 10th percentile would be the 10 percent of people with the least income. The highest income or upper limit in a group is the cutoff point for that percentile. In 2009, the cutoff points for various percentiles, rounded to the nearest thousand, were:
- The bottom 10 percent or 10th percentile: $12,000
- The bottom 20 percent or 20th percentile: $20,000
- The bottom 50 percent or 50th percentile: $50,000
- The top 20 percent or 80th percentile: $100,000
- The top 10 percent or 90th percentile: $138,000
- The top five percent or 95th percentile: $180,000
See detailed income definitions (PDF) Note: Amounts are in 2009 CPI-U-RS inflation-adjusted dollars.
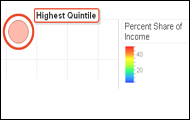
If you divide the population into five evenly-spaced percentiles, they are called quintiles. Use the motion chart below to track share of income by quintile over time. The share of total income is illustrated using size and color. The tabs below enable access to an interactive bar graph and line chart. Share the chart and time series data from Table A-2 with others: http://bit.ly/IncomeInequalityChart
2009 Economic Highlights
The American Community Survey's 2009 estimates also indicate a drop in household income and home values, an increase in the number of people receiving government assistance and a record number in poverty.
The Census Bureau defines household income as the income of the householder and all other people 15 years and older in the household, whether related to the householder or not. The median is the point that divides the household income distribution into halves, one half with income above the median and the other with income below the median. More Census definitions (PDF)
Here are some highlights from the 2009 data release:
Income
- The median household income for the United States was $50,221 -- an over the year decrease of about three percent.
- Median household income decreased in 34 states and increased in just one -- North Dakota.
- Maryland had the highest median household income at $69,272 followed by New Jersey, Connecticut, Alaska and Hawaii.
- Mississippi had the lowest median household income at $36,646.
- More than 79 percent of all U.S. households worked for a living and 17 percent received retirement income other than Social Security.
Housing
- The median property value for owner-occupied homes in the U.S. was $185,200 -- a decrease of 5.8 percent from last year.
- The median monthly housing costs for mortgaged owners was $1,505, $425 non-mortgaged owners and $842 for renters.
- Thirty-eight percent of owners with mortgages, 16 percent of owners without mortgages and 52 percent of renters in United States spent 30 percent or more of household income on housing.
Government Assistance
- Across the board, the number of households receiving government assistance increased.
- Just under 28 percent of U.S. households received Social Security.
- The average income from Social Security was $15,445.
- The percent of households receiving Supplemental Security Income edged up to 3.6 percent and the percent receiving food stamps jumped to 10.3 percent.
Poverty
- Thirty-one states saw increases in both the number and percentage of people in poverty.
- The poverty rate increased to 14.3 percent and there were 43.6 million people living below the poverty line. Learn more: Record Numbers of Americans in Poverty as Rate Rises
About the American Community Survey
The American Community Survey asks a sample of U.S. households questions about demographic, socioeconomic and housing issues. Responses to these questions help the government manage federal programs and comply with federal laws, regulations or court decisions and statistics gleaned from his survey are also used by businesses and officials at the state and local levels. Together with population data from the decennial or once-a-decade census, the ACS data help determine how more than $400 billion in federal funds are distributed to state and local areas each year.
Data from the ACS are released annually in the form of single and multi-year estimates. The 2009 release is an annual one-year estimate that is available for areas with populations of 65,000 or more, the Census Bureau said.
Read the press release: Census Bureau Releases 2009 American Community Survey Data
ACS Brief: Household Income for States: 2008-2009 (PDF)
Census Report: Income, Poverty and Health Insurance Coverage in the United States: 2009 (PDF) Time series data from Table A-2
American Community Survey: Selected Economic Characteristics: 2009
What Do You Think?
Share your thoughts in the comments section below or weigh in on Facebook or Twitter.
Data visualization by Anthony Calabrese, a State of the USA Web producer.