A record 43.6 million Americans were below the poverty line in 2009, according to new data from the U.S. Census Bureau. That's more than one in seven Americans and it's the largest number recorded in the 51 years that poverty estimates have been published, officials said.
Here are some highlights from the report:
- There was an over-the-year increase of 3.8 million people in poverty.
- Compared to the year the recession began, there was an increase of more than 6.3 million people in poverty.
- The poverty rate increased by 1.1 percent in 2009 to reach 14.3 percent - the highest level since 1994.
- There were 8.8 million families in poverty - an increase of 700,000 over the year.
- The poverty rate increased for children younger than 18, from 19.0 percent in 2008 to 20.7 percent in 2009; and for people 18 to 64, from 11.7 percent in 2008 to 12.9 percent in 2009. It declined for people 65 and older, from 9.7 percent in 2008 to 8.9 percent in 2009.
- The poverty rate for non-Hispanic whites was lower in 2009 than it was for other racial groups. The 2009 poverty rate for Asians was not statistically different from the 2008 poverty rate, but increased for all other race groups and for Hispanics.
- The poverty rate increased from 2008 to 2009 in the Midwest, South and West while all four regions had increases in the number of people in poverty.
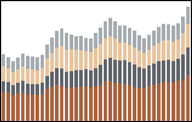
Use the interactive chart below to track poverty by state, region and recession

About the Official Measure of Poverty
The poverty thresholds referenced in the report are part of the federal poverty measure, which was originally developed in 1963-64 by Mollie Orsansky of the Social Security Administration. The official measure was based on the least expensive nutritionally adequate diet "designed for temporary or emergency use when funds are low" by dietitians at the Department of Agriculture. The poverty line was set at a multiple of the cost of that diet, based on the findings of a 1955 study showing that food costs are about 1/3 of a typical family budget.
Family size and several other factors determine the threshold, which is adjusted annually using the Consumer Price Index. Read this report from the Department of Health and Human Services to learn more: The Development and History of the U.S. Poverty Thresholds -- A Brief Overview
The Census Bureau plans to introduce a 'Supplemental Poverty Measure' in 2011 that will complement, but not replace the official measure. This experimental measure will take into account factors such as taxes, commuting costs, cost of child care and out-of-pocket health care expenditures, according to a Census Bureau report (PDF) on the issue.
Data Source:
U.S. Census Bureau: Income, Poverty and Health Insurance Coverage in the United States (PDF)
Historical Poverty Tables - Table 9 and Table 19
Change in Poverty During Income Years Surrounding Recessions: 1969-2009 (PDF)
What Do You Think?
Does the official poverty rate tell the whole story or are there alternative measures of poverty that provide greater insight?
Share your thoughts in the comments section below or weigh in on Facebook or Twitter.
Data visualization by Anthony Calabrese, a State of the USA Web producer.