 Print This
 RSS Feed
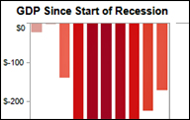
Nearly three years after the start of the recession, economic output has yet to fully recover, according to new data from the Bureau of Economic Analysis.
The most recent BEA estimates, released today, show that gross domestic product -- the country's total economic output in goods and services -- is still nearly $170 billion dollars short of pre-recession highs.In setting a June 2009 end date to the recession, the National Bureau of Economic Research looked at a range of economic indicators including the GDP. NBER's Business Cycle Dating Committee found that "the behavior of the quarterly series for real GDP and GDI (gross domestic income) indicates that the trough occurred in mid-2009. Real GDP reached its low point in the second quarter of 2009, while the value of real GDI was essentially identical in the second and third quarters of 2009.
"The average of real GDP and real GDI reached its low point in the second quarter of 2009. The committee concluded that strong growth in both real GDP and real GDI in the fourth quarter of 2009 ruled out the possibility that the trough occurred later than the third quarter," according to the group's Sept. 20 report.
The committee decided, based on the length and strength of the recovery to date, that any future economic downturn would be considered a new recession and not a continuation of the recession that began in December 2007. How has the economy performed since the recession officially ended in June 2009? Use the interactive graph below to track GDP growth over time.

Visit the State of the USA's economy section to learn more about the GDP.
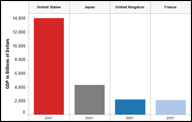
International GDP Comparisons
Is the U.S. falling behind other developed countries? Use State of the USA's interactive tools to explore how the gross domestic product of the U.S. measures up using 2009 data from the OECD.
Measuring Economic Well-Being
A visual comparison of median income and gross domestic product from 1967 to 2008 showed a wide gap between the growth of GDP per capita and median income. The latest income figures from the U.S. Census Bureau show only a slight reversal of long-term trends - but only because both measures fell last year. The Census Bureau report found that median household income decreased from $50,112 in 2008 to $49,777 in 2009 - making it 24 percent higher than 1967. New numbers from the Bureau of Economic Analysis show that GDP per capita fell from a revised $43,397 in 2008 to $41,890 in 2009 - making it 111 percent higher than it was in 1967.

State of the USA's Work and the GDP
The future of GDP and the global measurement movement was the subject of a recent New York Times magazine piece, which highlighted the work of State of the USA. See reader reaction to the article and the State of the USA's work and mission.
What Do You Think?
Have you read the first part of this series - A Portrait of the Recession: Jobs and Unemployment?
Share your thoughts in the comments section below or weigh in on Facebook or Twitter.
Data visualization by Anthony Calabrese, a State of the USA Web producer.