 Print This
 RSS Feed
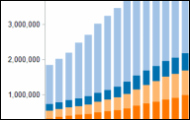
How many people are in prison, jail or on probation in the U.S. and how have those numbers changed in recent decades?
The latest data from the Bureau of Justice Statistics show that there were more than seven million people in the correctional system as of 2008, or one in every 31 adults. Of these, 30 percent were in prison or jail, and the actual number of prison or jail inmates more than tripled since 1980.
Despite significant gains since 1980, the data show that growth in the total correctional population has slowed since 2000. The correctional population increased by 0.5 percent during 2008, about a third of the average annual rate of growth of 1.6 percent since 2000.
The decline in the growth of the prison population that occurred during 2008 also continues a declining trend. From 2000 to 2008, the data show that the prison population increased an average of 1.8 percent annually, less than a third of the average annual rate of 6.5 percent during the 1990s.
Definitions
According to the BJS, corrections refers to the supervision of persons arrested for, convicted of or sentenced for criminal offenses. Correctional populations fall into two general categories: institutional corrections, such as prison or jail, and community corrections, such as probation and parole.
The BJS defines jail as confinement in a local jail while pending trial, awaiting sentencing, serving a light sentence (less than one year) or awaiting transfer to other facilities after conviction. Prison is generally defined as confinement in a state or federal correctional facility to serve a sentence of more than a year, but this varies in certain jurisdictions. Probation is an alternative to incarceration, defined as a court-ordered period of correctional supervision in the community. Parole is defined as period of conditional supervised release in the community following a prison term.The U.S. correctional population is part of a draft list of crime and justice measures suggested to State of the USA for discussion and debate on the road to determining which indicators are key. Public participation in this dialogue is strongly encouraged. Use the interactive stack graph below to see how the correctional population has changed over the past 30 years:

Now, let's take a look at where the money for corrections comes from.
The pie chart below breaks down the criminal justice spending by function: Data have been extracted from the Census Bureau's Annual Government Finance Survey and Annual Survey of Public Employment. The data include national and state-by-state estimates of government expenditures and employment for the following justice categories: police protection, all judicial (including prosecution, courts, and public defense), and corrections. Federal data for the same categories are also included, as are data for the largest local governments (counties with populations of 500,000 or more and cities with populations of 300,000 or more), according to BJS.
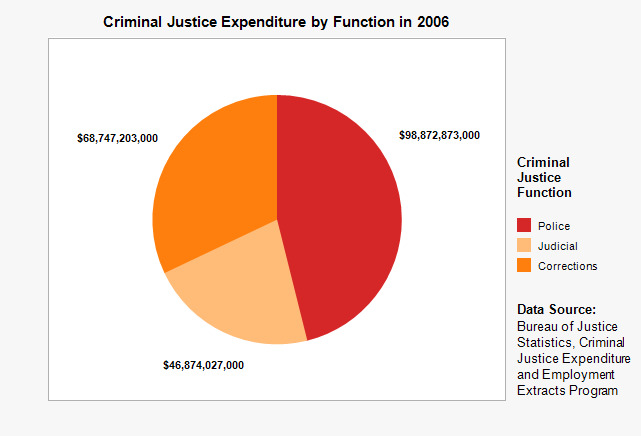
Police received about 46 percent of funds in 2006, the most recent year that BJS expenditure data were available. Corrections took in over 32 percent and Judicial received close to 22 percent, according to the data.
Data Sources:
Bureau of Justice Statistics, Correctional Surveys and Total Correctional Population
Bureau of Justice Statistics, Criminal Justice Expenditure and Employment Extracts Program
What Do You Think?
Are we getting the most bang for our buck?
Where would you like to see more or less money spent?
Do you feel safer knowing that over 2 million people are behind bars?
Share your thoughts in the comments section below or weigh in on Facebook or Twitter.
Data visualization by Anthony Calabrese, a State of the USA Web producer.