 Print This
 RSS Feed
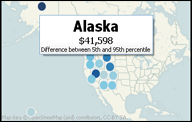
The amount of revenue per pupil for the 2007-2008 school year varied greatly nationwide, both within and between states, according to a recent report by the National Center for Education Statistics.
Alaska tops the list with a median of $26,000 per child -- meaning revenue numbers for half of the state's school districts come in higher and half lower. That's more than double the median figure of $11,259 for the nation, and more than triple Tennessee's median revenue, which is just under $8,000 per student. Revenue includes funds received from local, state and federal sources, and is measured and compared on a per pupil basis.
But before you move to Alaska, consider this: the gap between revenue per pupil for the bottom five percent and the top five percent of school districts is greater than $40,000 -- the widest in the nation.
(Unlike the statistical "mean," which is a measure of the average value of all of the numbers -- in this case, revenue per pupil -- in a given set -- in this case, total school districts -- the median is the point at which half of the data points are above that value and the other half are below it. Learn more about the significance and differences between mean and median here. )
A high median doesn't guarantee that all Alaskan school districts have equal amounts available to spend. The bottom five percent of Alaskan school districts have just $12,049 per child or less, which while still better than the national median is less than half of the state's median. The top five percent of Alaskan districts have $53,648 or more available to spend per child -- the highest in the nation.
These large differences are typical with more than half of the states reporting per-child revenues at least doubling between the fifth and 95th percentile cut points, according to the report.
The NCES defines revenue as, "additions to assets that do not incur an obligation that must be met at some future date, do not represent exchanges of fixed assets, and are available for expenditure by the LEAs [local education agency] in the state. Revenues include funds from local, intermediate, state, and federal sources."
This differs from expenditures, which are defined as "all amounts of money paid out by a school system." If revenues are funds available to spend, expenditures are funds that are actually spent.
For a complete list of total revenue per pupil at the median, fifth and 95th percentile cut points, see the interactive chart below.

Data on elementary and secondary school finances are part of The State of the USA's draft set of education measures.
Suzette Lohmeyer is a staff writer and producer for State of the USA.
Data visualization by Anthony Calabrese, a State of the USA Web producer.