 Twitter
 |
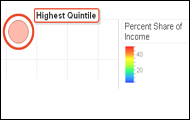
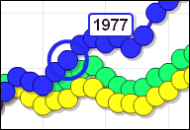
The income gap between the richest and poorest Americans is the widest on record, according to the latest Census release. A motion chart tracks the gap over 40-plus years.
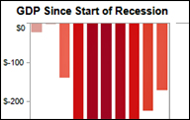
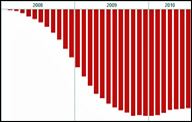
Nearly three years after the start of the recession, U.S. economic output has yet to surpass December 2007 highs, according the latest estimates How has the economy performed since the recession officially ended in June 2009? Use an interactive graph to track GDP during the recession and since.
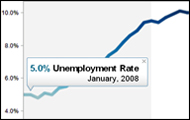
The recession officially ended in June of 2009, but unemployment remains high, according to Labor Department data and a recent report by the National Bureau of Economic Research. An interactive graph offers a look back at the unemployment rate and job growth since the start of the recession.
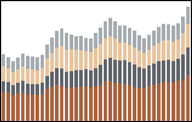
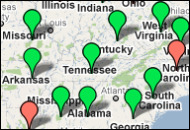
Use an interactive chart to track the number of people living in poverty by region, the effects of recent recessions, and the poverty rate by state for the past three years.
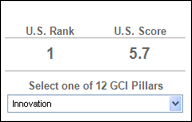 The U.S. is losing its competitive edge due to the fallout from the financial crisis, growing government debt and widening deficits, according to a new report on global competitiveness issued by the World Economic Forum. Use an interactive chart to see where the U.S. stands in the WEF's Global Competitiveness Index rankings.
Related: How Does the U.S. Compare in GDP, Health and Education? See for Yourself
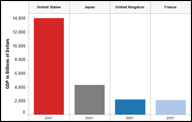
Use State of the USA's interactive tools to explore how the U.S. compares to other nations the U.S. in health, education and the economy.
Real gross domestic product increased at a revised annual rate of 1.6 percent in the second quarter of 2010, according to the "second" estimate released by the Bureau of Economic Analysis.
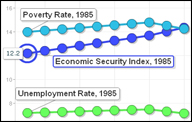
A new economic index sponsored by the Rockefeller Foundation finds more Americans were economically insecure at the start of the recession than in 1985. Explore the ESI and compare it with the unemployment rate and the poverty rate through 2007.
Despite recent economic growth, the U.S. still has a long way to go to reach pre-recession levels of employment. Use an interactive chart to compare job growth since the start of the recession in the private sector and in federal, state and local government.
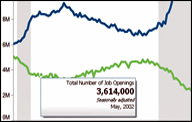
There are more unemployed people than there are available job openings and the recession has made it much more challenging for them to find work, according to new data from the Bureau of Labor Statistics. Explore the number of job openings and the number of unemployed people over time.
Total nonfarm payroll employment declined by 131,000 in July, and the unemployment rate was unchanged at 9.5 percent, the U.S. Bureau of Labor Statistics reported today.
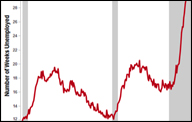
Related: Quantifying Long-Term Unemployment's Toll
Long-term unemployment affects more than just finances, according to a new study by the Pew Research Center. Researchers found that compared to those who faced short-term unemployment, people out of work for six months or longer lost not only more income, but more promising career paths, close friends, self-respect and good family relations.
 Foes of restaurant smoking bans may argue that they threaten profits, but a new study of how a Washington State ban has affected taxable sales in bars and taverns suggests the opposite. Is the experience of one state a predictor for others?
Are median income measures better than GDP for gauging a nation's economic health? Draw your own conclusions with this visualization charting historical GDP and median income data.
How much is a bachelor's degree worth? It may depend on your gender. Use dual motion charts to track the percentage of young males and females with bachelor's degrees from 1980 to 2008 and compare results with annual earnings for both groups -- a small sample of Education and Economy content in the works for the upcoming beta site.
![]() How much does the federal government spend, how is that money raised, where does it go and how has spending changed over time? A State of the USA tutorial.
How much does the federal government spend, how is that money raised, where does it go and how has spending changed over time? A State of the USA tutorial.

Just because you're out of work doesn't mean you're officially unemployed. How could that be? One example of an interactive tutorial on how statistics are developed and what they represent.