 Twitter
 |
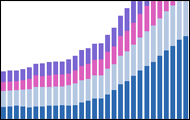
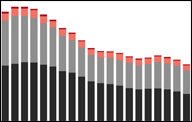
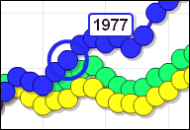
One out of every 10 adults in the U.S. has diabetes and that number may double or triple by 2050, according to the Centers for Disease Control and Prevention. Use an interactive chart and stack graph to track diabetes prevalence in the U.S. from 1980 to 2008.

What do a bunch of statisticians do to celebrate World Statistics Day? Don't expect a parade down Independence Avenue.
New 2009 Census data finds second generation immigrants better educated, earning more and less likely to be in poverty than foreign-born immigrants. Compare the educational attainment of different generations of immigrants
Hispanics are living longer than other racial and ethnic groups in the U.S., according to a new report from the Centers for Disease Control and Prevention. Compare the latest longevity estimates from the CDC.
CDC statisticians only recently have been able to overcome data-quality concerns and produce reliable life-expectancy estimates for Hispanics. What's been so hard about it?
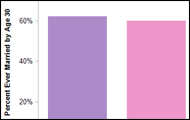
For the first time in more than a century, people with a college degree are beating their less educated counterparts down the aisle, and white women under 40 are leading the charge.
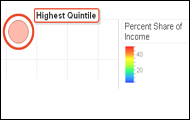
The income gap between the richest and poorest Americans is the widest on record, according to the latest Census release. A motion chart tracks the gap over 40-plus years.
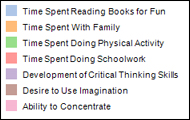
A new study on the reading habits of kids finds digital or electronic devices may have a negative effect on reading time, family time and physical activity -- and 39 percent of children ages 9 to 17 years old think that the information that they find online is always correct. Use an interactive graph to see how advances in digital technology are changing a generation of young Americans.
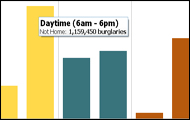
The stereotypical burglary of the unknown masked man armed with a gun, breaking into a house and violently attacking its residents, is usually not the case, according to a new Bureau of Justice Statistics report that uses a revised definition of burglary to assess burglary-related violence.
 A new health analysis shows a wide range of depression rates among states and finds demographic disparities in relation to gender, age, health insurance coverage and employment status.
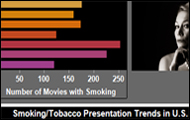
Recent research finds exposure to on-screen smoking in feature films increases the likelihood that young people will start smoking tobacco. An interactive chart looks at the percentage of movies with on-screen smoking, from 1999 to 2008.
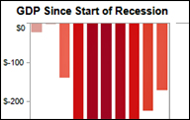
Nearly three years after the start of the recession, U.S. economic output has yet to surpass December 2007 highs, according the latest estimates How has the economy performed since the recession officially ended in June 2009? Use an interactive graph to track GDP during the recession and since.
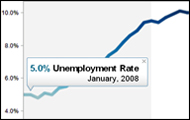
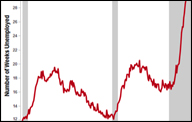
The recession officially ended in June of 2009, but unemployment remains high, according to Labor Department data and a recent report by the National Bureau of Economic Research. An interactive graph offers a look back at the unemployment rate and job growth since the start of the recession.
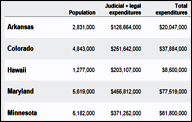
Most state, county and local public defender programs lack adequate resources to deal with their caseloads, according to two new reports by the Bureau of Justice Statistics.

A new Census Bureau report says a sharp rise in the number of opposite-sex unmarried couples living together may be less about romance and pending marriage and more about jobs.
What do you think?
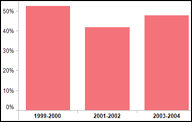
Fewer Americans are participating in the arts, according to a recent study conducted by the National Endowment for the Arts and the U.S. Census Bureau. Use an interactive graph to track trends. See a breakdown of who participated by gender, race/ethnicity, age and education.
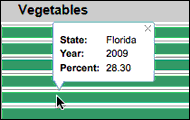
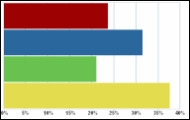
Fewer than a third of U.S. adults consume recommended amounts of fruit and about a quarter eat the suggested number of vegetable servings each day. Compare fruit and vegetable consumption among U.S. adults by state and year.
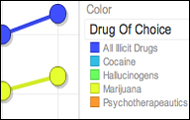
A federal survey finds illicit drug use is on the rise, with marijuana the illegal drug of choice and young males the most likely current users. Also noted, a significant increase in the number unemployed illicit users. A motion chart tracks usage by drug since 2002.
Use an interactive chart to track the number of people living in poverty by region, the effects of recent recessions, and the poverty rate by state for the past three years.
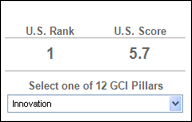 The U.S. is losing its competitive edge due to the fallout from the financial crisis, growing government debt and widening deficits, according to a new report on global competitiveness issued by the World Economic Forum. Use an interactive chart to see where the U.S. stands in the WEF's Global Competitiveness Index rankings.
Related: How Does the U.S. Compare in GDP, Health and Education? See for Yourself
Violent crime has fallen for the third straight year, according to new data from the FBI. Murder and robbery saw sharp declines, while rape fell by just 2.4 percent when compared to 2008 estimates. Use a stack graph to see violent crime trends over time.

The U.S. smoking rate has held steady in recent years, but exposure to secondhand smoke has declined significantly, according to a pair of new studies from the Centers for Disease Control. Use an interactive chart to dig into the demographics of current smokers and secondhand smoke exposure.
Revenue per pupil for public elementary and secondary school students vary greatly between and within states, according to a new report from the National Center for Education Statistics. Compare education funding by region and state for the 2007-2008 school year.
 A quarterback averages 1.75 touchdown passes for a season. But in more than half of his games, he threw for one touchdown or fewer. Which statistic is more important for evaluating his success?
Nationwide, 4.4 percent of male and female prison inmates and 3.1 percent of jail inmates surveyed between 2008 and 2009 say they had been victims of sexual abuse, according to a new report by the Bureau of Justice Statistics.
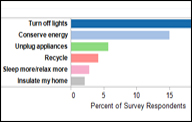
Americans are taking steps to conserve energy, just not the most effective ones, according to a new report by Columbia University's Earth Institute.
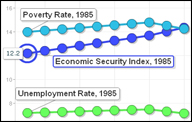
A new economic index sponsored by the Rockefeller Foundation finds more Americans were economically insecure at the start of the recession than in 1985. Explore the ESI and compare it with the unemployment rate and the poverty rate through 2007.
 In 2007 Red Sox rookie Jacoby Ellsbury batted .353 while teammate Mike Lowell batted .324. In 2008, Ellsbury again outperformed Lowell, batting .280 to Lowell's .274. Therefore Ellsbury outperformed Lowell over the two-year stretch. True or false?
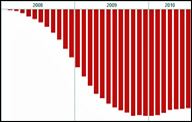
Despite recent economic growth, the U.S. still has a long way to go to reach pre-recession levels of employment. Use an interactive chart to compare job growth since the start of the recession in the private sector and in federal, state and local government.
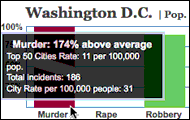 New York, the nation's most populous city, scores well below average for all of the offenses tracked by the FBI's annual Uniform Crime Report. Explore violent crime and property crime rates for the 50 most populous U.S. cities using a sortable table and interactive bar charts.
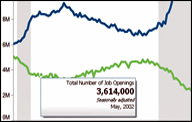
There are more unemployed people than there are available job openings and the recession has made it much more challenging for them to find work, according to new data from the Bureau of Labor Statistics. Explore the number of job openings and the number of unemployed people over time.
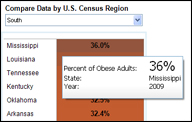
Every state in the union has fallen short of national health objectives for lowering obesity rates, according to new data from the Centers for Disease Control. Explore the data for adults ages 20 and up, and compare it to previous years going back to 2006.
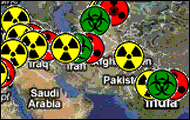 Navigate maps, satellite imagery and Google Earth to explore the profiles of countries identified by the independent Nuclear Threat Initiative as having any attempted, former or established programs capable of producing weapons of mass destruction.
Related: Quantifying Long-Term Unemployment's Toll
 Carbon dioxide emissions are rising worldwide with just 20 countries responsible for more than 75 percent of them, according to new data from the Carbon Dioxide Information Analysis Center. How do the world's nations measure up? What's a nation's output come to per person? And just how big is a metric ton of CO2? Use an interactive dashboard to analyze CO2 emissions data.
The latest federal data shows overall population growth is in decline. But how many people are in prison, jail or on probation in the U.S. and how much do we spend on them? Use an interactive stack graph to track the growth of the correctional population in recent decades.
 Net-worth disparities among races and education levels, more older women in the labor force and a growing veteran population are among the highlights of a new government report on indicators of aging in the U.S.
 A new federal report on children in America includes some promising news on pre-term birth, teenage pregnancy and health care coverage. The report, which covers the health, activities, and general well-being of America's kids, found less promising statistics on child poverty and food security. Explore "America's Children in Brief" using an interactive reader.
 Join in deciding how best to measure progress by weighing in on a draft set of indicators offered by the former U.S. commissioner for education statistics. Public participation is encouraged as part of the process of determining the key national indicators of education.
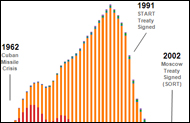 The Department of Defense recently disclosed the size and composition of of the U.S. nuclear arsenal for the first time. How do we measure up against other 'declared' nuclear states? Use an interactive stack graph to compare nuclear stockpiles over time.
Vizworld: 'One of the most beautiful' and clean Tableau visualizations I've seen'
The Department of Defense recently disclosed the size and composition of of the U.S. nuclear arsenal for the first time. How do we measure up against other 'declared' nuclear states? Use an interactive stack graph to compare nuclear stockpiles over time.
Vizworld: 'One of the most beautiful' and clean Tableau visualizations I've seen'
 Identity theft is on the rise, with younger and wealthier households among the more likely victims. ID theft is on an initial short list of measurable items recommended to State of the USA for tracking crime and justice in the U.S.
 Foes of restaurant smoking bans may argue that they threaten profits, but a new study of how a Washington State ban has affected taxable sales in bars and taverns suggests the opposite. Is the experience of one state a predictor for others?
 Identifying the most important measures of any issue requires an open dialogue that considers what the American people want to know and what experts consider most important for them to understand. Participate in shaping crime and justice coverage by weighing in on an draft set of measures compiled by a noted criminologist.
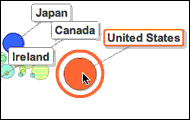
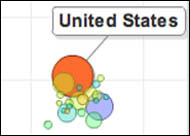
Are median income measures better than GDP for gauging a nation's economic health? Draw your own conclusions with this visualization charting historical GDP and median income data.
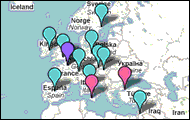
Take an in-depth look at the organizations measuring progress around the world. An interactive map highlights participants in the Global Project on Measuring the Progress of Societies.
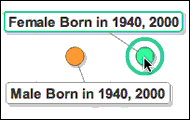 How have percentages of men vs. women in a given generation changed over time? And what unique factors might be in play from one 20th century generation to the next?
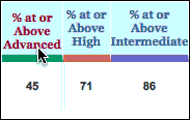
With 45 percent of students at or above 'advanced' in math, Taiwan is among the top performing nations in the most recent international science and math assessments. The U.S. rate is 6. The next assessment takes place in the coming school year.
Related: International Science Achievement
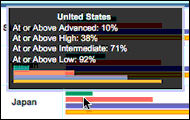
Should your middle schooler be brushing up on science during the summer break? Explore how U.S. fourth- and eighth-graders compare to their international peers with our interactive graphical scorecard. Tomorrow: Math.
Related: International Math Achievement
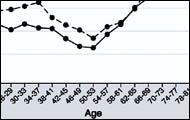 Happiness comes with age -- age 50 to be exact -- according to a new report published in the Proceedings of the National Academy of Sciences.
Curiosity and enthusiasm are evident in reader comments and other feedback following a New York Times Magazine piece highlighting the State of the USA's work.
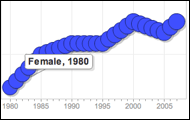
How much is a bachelor's degree worth? It may depend on your gender. Use dual motion charts to track the percentage of young males and females with bachelor's degrees from 1980 to 2008 and compare results with annual earnings for both groups -- a small sample of Education and Economy content in the works for the upcoming beta site.
 State of the USA's editorial team experiments with various interactive data visualization techniques, and will enable users to do the same -- work that owes much to the legendary battlefield nurse and pie chart trailblazer born 190 years ago this spring. (With an audio salute to her wartime comrades circa 1854.)
Information gaps come to light when statisticians are asked to supply data for an important policy question not yet answered with hard facts. In other words, someone somewhere is faced with making critical decisions in a vacuum. Understanding the living arrangements of the nation's elderly is just one example.
Magazine writer Jon Gertner explores the work of The State of the USA as part of a movement that seeks to redefine the way progress is measured, communicated and debated in the Unites States and other countries - with more evidence and less opinion.
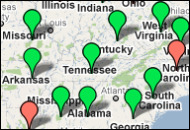
How are cities, states and regions in the United States measuring progress? What is being measured and who is doing the measuring? An interactive map highlights indicator efforts across the U.S..

State of the USA is participating with the Organization for Economic Co-operation and Development to support the collection of quality international data on a wide range of issues.
![]() A panel of 14 experts selected by the Institute of Medicine provided guidance to the State of the USA on what to include in a focused set of 20 measures for tracking progress in the areas of health and health care.
A panel of 14 experts selected by the Institute of Medicine provided guidance to the State of the USA on what to include in a focused set of 20 measures for tracking progress in the areas of health and health care.
Image: Institute of Medicine logo
![]() How much does the federal government spend, how is that money raised, where does it go and how has spending changed over time? A State of the USA tutorial.
How much does the federal government spend, how is that money raised, where does it go and how has spending changed over time? A State of the USA tutorial.
On the eve of a new president's first address to Congress, Kenneth M. Duberstein, chief of staff from 1988 to 1989, called for a bipartisan effort to establish and make publicly available a comprehensive online database of key national indicators.
 The State of the USA will offer a variety of interactive features and techniques to encourage exploration, such as this motion chart with audio tutorial focusing on health costs and outcomes for the developed world.

Just because you're out of work doesn't mean you're officially unemployed. How could that be? One example of an interactive tutorial on how statistics are developed and what they represent.
The statistics editor of London's Financial Times surveys efforts to understand the progress of societies through measurement, including the State of the USA, in a January 2009 column.
 Explore international health costs and outcomes for developed countries, comparing data in an animated chart.
 Although most economists agree that education packs a powerful economic punch, they disagree on what contributes to the payoff.